 In this blog, Cobus Daneel discusses a CMI project that investigated the benefits and downsides of adopting different approaches to modelling mortality projections.
The Continuous Mortality Investigation (CMI) Mortality Projections Committee (MPC) worked on a joint project with the Society of Actuaries (SoA) to fit UK and US mortality projection models to each other’s data. The primary aim of the project was to investigate how different mortality projections model react to the same dataset to understand the benefits and downsides of adopting different approaches to modelling mortality projections. The results of the analysis were published in the publicly available Working Paper 166.
The two models have similar principles – both project mortality improvements by interpolating between recent mortality improvements, estimated based on historical data, and assumed long-term rates of mortality improvement. However, the details of the models differ, including:
Comparing the two models is a useful exercise to understand the advantages and disadvantages of using a particular approach when modelling mortality projections. This can be an informative exercise, particularly in the context of the level of uncertainty involved in predicting future mortality trends.
Our analysis of the two models focussed on comparing how results for a given country vary between the two models, rather than how results from the two models vary between the countries. However, we did analyse historical mortality trends for the two countries.
Mortality rates in 2019 at ages in the 20s were over twice as high in the US than in England & Wales data. The ratio decreases fairly steadily with increasing age and mortality rates at age 100 are very similar in the US and in England & Wales.
Our comparison of age-standardised mortality rates (ASMRs) showed that mortality was higher in England & Wales than in the US during the 1970s, 80s and early 90s, but has been higher in the US than in England & Wales in recent years. In other words, mortality improvements have been higher in England & Wales than in the US for much of that period.
When considering historical improvements for the US and England & Wales by age and calendar year, we found that:
Differences in the structure of historical improvements for the US and England & Wales provided us with a good opportunity to understand the two models better.
The heatmaps below show the fitted and projected mortality improvements from applying the MIM-2021 and CMI_2021 models to England & Wales data for males. We also show the difference between them.
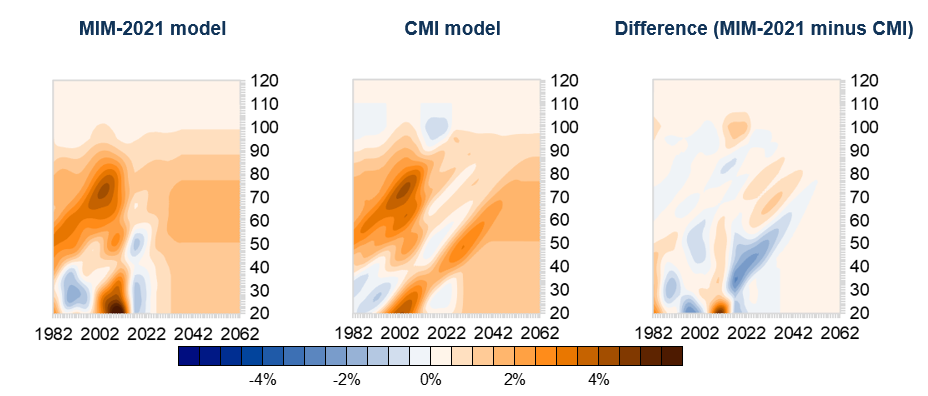
We see that a key difference between the two models is the treatment of cohort effects, with the CMI model fitting stronger cohort effects that persist longer than the US model. Results were qualitatively similar for females, but with more modest differences.
Despite the different patterns of mortality improvements, the differences in life expectancies were relatively modest. Working Paper 166 has further information on this, as well as analysis of initial improvements, projected mortality rates, and sensitivities to the long-term rate parameter.
While we do not currently have any plans to undertake similar comparisons with other international actuarial organisations, we regularly discuss methods and topical issues with other actuarial organisations. Ff subscribers have found the analysis informative then we would be open to undertaking similar analyses in the future.