 The CMI has updated the CMI Mortality Projections Model so it can better reflect the impact of the pandemic in different countries. This blog describes the changes and the reasons for them.
The CMI made a significant change to its treatment of the COVID-19 pandemic in the latest version of the CMI Mortality Projections Model, CMI_2024, which was published in June 2025.
Previous versions of the model had used “weights” to reduce or eliminate the impact on projections of years which had unusual mortality experience due to the pandemic. This led to smooth projections that focussed on sensible outcomes for life expectancy but did not reflect the actual pattern of mortality through the pandemic.
CMI_2024 takes a different approach to the pandemic. It models mortality as the combination of “underlying” mortality and an “overlay”. The model for underlying mortality is like previous versions of the CMI Model, but with the ability to better model different trends at different ages. The overlay is new. It explicitly models the increase in mortality caused by the pandemic, with a jump in mortality at the start of the pandemic and a steady decrease in the pandemic impact over time.
The overlay was introduced following extensive consultation and has been well received. The CMI benchmarking survey shows that a significant number of UK insurers and reinsurers intend to use it for their end-2025 results.
However, although the structure of the overlay works well for the UK, it does not work so well in all countries.
The original version of CMI_2024 assumed that the overlay started in a specific year, was highest in that year, and decreases exponentially. But the impact of the pandemic has been different in different countries. For example, the US had similar excess mortality in 2020 and 2021 before falling in 2022.
The updated software gives users of the CMI Model more flexibility in specifying the “run-off schedule” – the progression of the overlay over time and by age – but the Core CMI_2024 assumptions have not changed.
To show the potential use of the flexible overlay, we have calibrated CMI_2024 to US male data from the Human Mortality Database for 1984-2023 for two different shapes for the overlay. The charts show the resulting age-standardised mortality rates (ASMRs)
The left-hand chart uses the same assumption as the Core version of CMI_2024, intended for the UK – the overlay starts in 2020 and halves in each successive year. The right-hand chart uses a simple illustrative alternative assumption – the overlay is the same in 2020 and 2021 and halves each year after that.
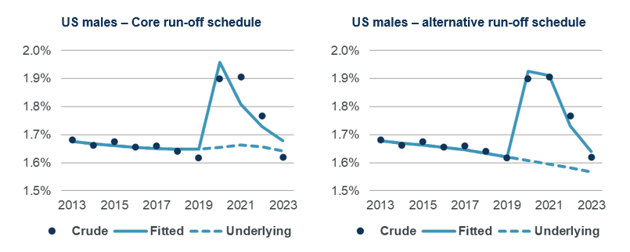
Using the Core CMI_2024 run-off schedule for the US males leads to a poor fit to the historical data, particularly in 2021, and underlying mortality that rises in 2021 before falling again. Using the alternative run-off schedule fits the data better and leads to a more plausible pattern for underlying mortality.
We intend to publish further analysis of the flexible overlay, including consideration of other countries and varying the run-off schedule by age as well as year, in our annual research paper (currently called the “interim update”) in December 2025.
At that time, we will also provide an update on our plans for the next version of the CMI Model, CMI_2025, which we aim to publish in March 2026. When publishing CMI_2024, we noted our hope that CMI_2025 could be a “business as usual” update with no changes in method and only a routine update to the calibration dataset. We do not anticipate any changes in method for CMI_2025 at present.