


Authors

The CMI Self-administered Pension Schemes (SAPS) Committee has published an investigation into the seasonality of mortality in the SAPS dataset, and a comparison to the general population. The analysis investigates experience by month rather than by calendar year, as we typically do for analyses.
This blog briefly summarises key points from the analysis. CMI subscribers can find more detail in Working Paper 217.
Why investigate seasonality?
Seasonal variations in mortality are well established in the general population, with mortality typically being higher during winter months than summer months. Our analysis considers the following questions:
How does the experience of the SAPS dataset vary on a sub-annual basis, and how do these variations change over time?
Are there any groups of members that are particularly affected by the seasonal variations in mortality?
Do seasonal variations in mortality in the SAPS dataset differ to seasonal variations in mortality in the general population?
How sensitive is the experience of the dataset to the 12-month period we define as a year?
What data do we analyse?
The SAPS investigation collects data for UK self-administered defined benefit pension schemes with more than 500 pensioners. This is provided by actuarial consultancies, the Pension Protection Fund (PPF) and the Government Actuary’s Department (GAD) and covers both private sector and public sector schemes.
The analysis uses the SAPS dataset covering calendar years 2017 to 2024 inclusive and considers male pensioners, female pensioners, and female dependants separately (we exclude male dependants from most of the analysis in the paper as data volumes for this group are low). The 2017 to 2024 dataset is large, comprising over 350 pension schemes, and around 22,500,000 person-years of exposure.
We also include an analysis of the general population using data provided by the Office for National Statistics (ONS).
We would like to encourage firms to submit data for all schemes with 500 or more pensioners. Unless more data is submitted to replace the older data as it drops out, the quantity of data will diminish and our ability to analyse experience will be reduced. For more information about data submission, see the SAPS Coding Guide.
How do we analyse the data?
We assess mortality experience using both actual/expected (A/E) measures and age-standardised mortality rates (ASMRs).
We also consider a ‘seasonality ratio’ alongside monthly results. This is defined as the average A/E in the winter months (defined as December, January, and February) divided by the average A/E in the summer months (defined as June, July, and August).
What do the monthly mortality patterns look like?
For all pensioner types considered, experience was notably heavy in March, April and May 2020, and April 2020 was the heaviest month in the 8-year investigation period. Experience in late 2020 and the first quarter of 2021 was also heavier than normal, due to the impact of the COVID-19 pandemic.
In years that were not affected by the COVID-19 pandemic, such as 2017, 2018, and 2019, we can observe the typical seasonal nature of mortality: experience in the winter months is notably heavier than experience in the summer months.
Chart 1: Monthly 100 A/Es by pensioner type, lives-weighted compared to S4PxL or S4DxL:
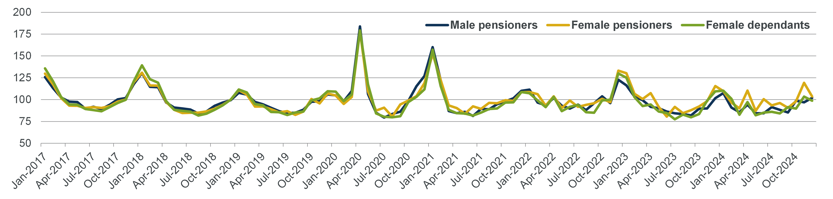
The 2017 to 2018 winter (that is, December 2017 to February 2018) and 2022 to 2023 winter are heavier than other winters for all pensioner types (excluding the periods affected by the COVID-19 pandemic). This is consistent with data published by the UK Health Security Agency (UKHSA), which identified that the UK general population experienced a much higher number of influenza-associated deaths in the 2017 to 2018 (25,000) and 2022 to 2023 (14,000) winters than in other winters in our investigation period.
Which groups are most affected by seasonal mortality?
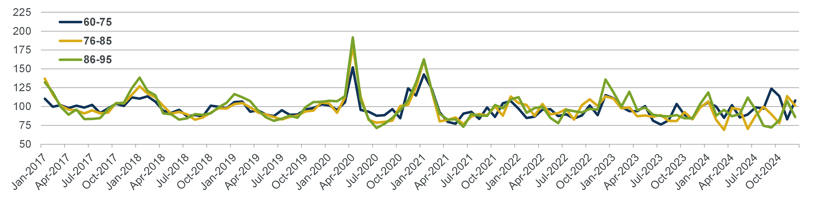
Our analysis suggests that seasonal mortality becomes more pronounced at older ages. For all 3 pensioner types, the oldest age band (86 to 95) is most heavily affected by seasonal patterns in mortality, and the youngest age band (60 to 75) is least affected.
Chart 2: Female pensioner monthly 100 A/Es, amounts-weighted compared to S4PFA, by age band:
The analysis does not identify a clear difference between the seasonality of mortality for ‘normal health’ and ‘ill-health’ pensioners (where the indicator shows the health status of the pensioner at retirement). We note that there may be limitations to the categorisation (for example, the definition of ill-health will vary by pension scheme, and the health status is only known at a single point in time).
Does socio-economic status affect the seasonality of mortality?
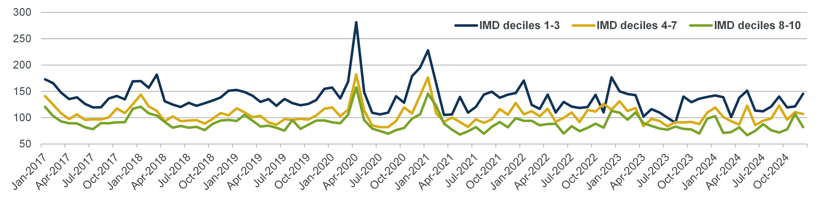
We also consider how seasonality of mortality varies by IMD decile (grouped into 3 bands), and by pension amount band (2 proxies for socio-economic status).
For all 3 pensioner types, the least deprived IMD decile grouping (8 to 10) has the lowest average seasonality ratio (excluding 2021), suggesting individuals in this group are less affected by seasonal variations in mortality than individuals in other groups.
For male pensioners, the seasonality ratio is highest for individuals with the smallest pensions, and lowest for individuals with the largest pensions. These conclusions are similar to those for the IMD decile results – that is, the most affluent individuals appear to be least affected by seasonal variations in mortality.
The results by pension amount for female pensioners are less clear and the seasonality ratios for the different amount bands are less clearly ordered. In previous analyses, we have seen that pension amount is a less powerful predictor of mortality for female pensioners than for male pensioners, so this result is not unexpected.
Chart 3: Male pensioner monthly 100 A/Es for the IMD dataset, amounts-weighted compared to S4PMA, split by IMD decile grouping:
How does SAPS experience compare to the general population?
We also compare mortality experience in the SAPS dataset with that observed in the general population of England and Wales using ASMRs.
In most months, the absolute ASMRs are heavier for males in England and Wales than for male pensioners in our dataset. We observe a similar result for females in England and Wales compared to female pensioners. Female dependants experienced similar monthly mortality rates to those of the general population.
In most years, male pensioners had a higher seasonality ratio than males in the general population. The patterns for females are less clear.
We note that the ASMRs for the general population and the SAPS dataset may not be directly comparable, as the England and Wales death data is collated based on a ‘registrations’ basis, whereas SAPS death data is collected on an ‘occurrences’ basis.
Does the definition of a ‘year’ matter?
Finally, we consider how the experience of the dataset varies depending on the definition of year (that is, whether we look at the 12-month period from January to December or another 12-month period). There are notable differences in the experience of the dataset depending on the definition of calendar year.
The results by calendar year compared to projected base tables are relatively smooth – this is perhaps to be expected, as the CMI Model is calibrated to the calendar year.
The results compared to unprojected base tables are heavily influenced by which 12-month period includes the peaks of the pandemic around April 2020 and January 2021.
What are the committee’s future plans?
We will continue to collect pension scheme data and publish annual analyses of mortality experience – we are planning to publish the next annual experience analysis, covering the period 2018 to 2025, in early 2027.
We typically also produce a ‘one-off’ analysis, such as this seasonality paper, each year. Please let us know if you have any suggestions for future analyses by emailing self-admin@cmilimited.co.uk.