 Chris Reynolds, Chair of the CMI Assurances Committee, discusses results of analysis of term assurance claims by month, published in Working Paper 176. The work builds on previous analysis of experience by month in 2019 and 2020, by adding new 2021 data.
The CMI Assurances Committee has analysed how the COVID-19 pandemic affected mortality and accelerated critical illness term assurances claims during 2020 and 2021, compared with 2019, in Working Paper 176. This updates previous analysis in Working Paper 162, for 2020 claims were compared against 2019.
This blog presents some of the results of this analysis, focusing on trends in the number of incurred claims only. The working paper itself includes results of an experience analysis, comparing incurred claims with expected claims calculated using the “16” Series term assurance tables. Further detail on the dataset and methodology is provided in the working paper but we note two of the main data considerations below:
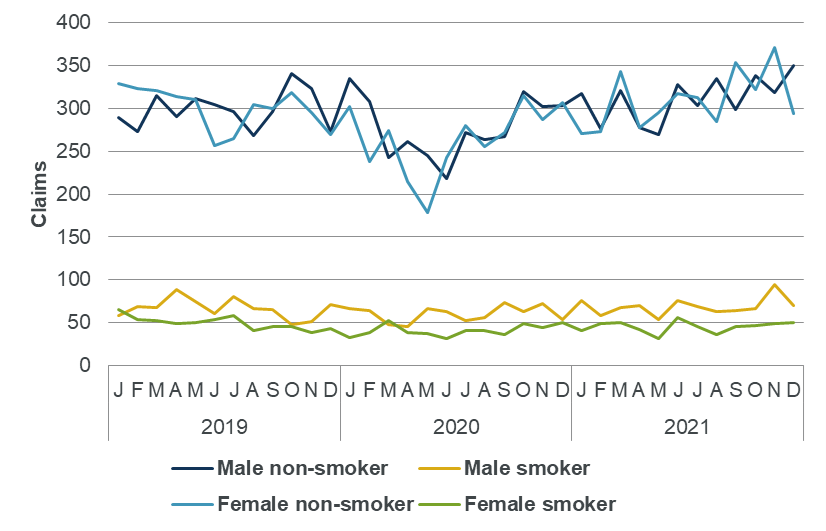
We show incurred claims by month for term mortality in 2019 to 2021 in Chart A. Claims are split by gender and smoker status, in line with our typical term assurance analyses.
There are several features common to both male subsets, and the female non-smoker subset:
These characteristics in the shape of mortality by month appear broadly consistent with the features seen in the general population for this period.
These trends are less apparent for female smokers, the smallest subset of the dataset, due to the scale of the y axis. Interestingly, there is a peak in claims in December 2020, which is seen one month later in all other subsets.
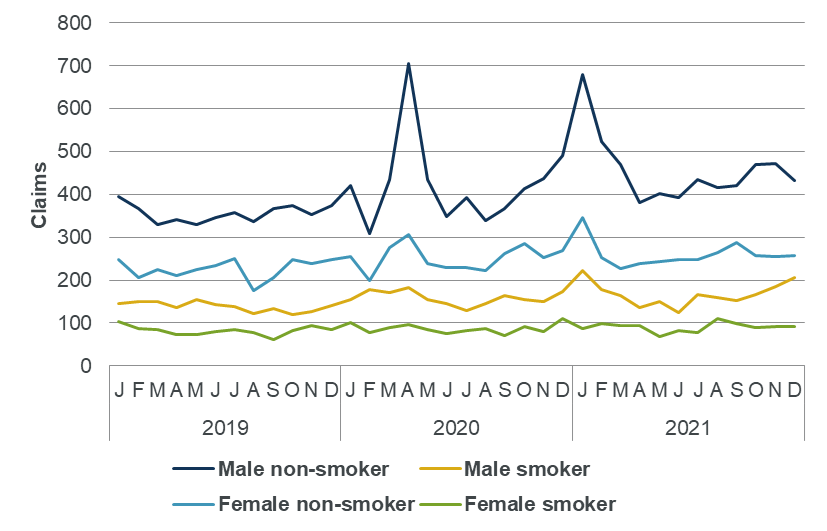
Chart B shows the corresponding picture for accelerated critical illness, which includes both mortality and critical illness claims.
The trends in male and female non-smoker claims are easy to compare as the number of claims are very similar (average monthly claims in 2019 is 298 for males and 300 for females). Both male and female non-smoker claims generally trend downwards over the first half of 2020, a period coinciding with the first wave of the COVID-19 pandemic, with females experiencing a bigger decrease.
The differences in the size of the decrease may be explained by the higher proportion of deaths for males and a higher proportion of cancer claims for females. Our analysis of experience by cause of claim in Working Paper 167 showed the effect of the COVID-19 pandemic on each of these causes in 2020 and we hope to be able to update this analysis in the future.
The rebound in claims during late 2020 and 2021 appears very similar for male and female non-smokers. Again, the results in late 2021 are subject to considerable uncertainty.
Trends are less apparent for male and female smokers in this chart as volumes are low and experience relatively erratic.