 The Continuous Mortality Investigation (CMI) Self-administered Pension Schemes (SAPS) Committee has published its latest annual analysis of the mortality experience of members of UK defined benefit pension schemes. This covers the period 2015-2022 and is the first experience analysis following the release of the S4 Series mortality tables.
This blog briefly summarises key points from the analysis. CMI Subscribers can find more detail in Working Paper 190.
The SAPS investigation collects data for self-administered defined benefit pension schemes with more than 500 pensioners. This is provided by actuarial consultancies, the Pension Protection Fund (PPF) and the Government Actuary’s Department (GAD) and covers both private sector and public sector schemes.
The 2015-2022 dataset is large, comprising over 400 pension schemes, and around 26,500,000 person-years of exposure.
We show a ratio of the 2020, 2021, and 2022 age-standardised mortality rates (ASMRs) to the 2019 ASMRs in the following chart. Given the low volumes of data for male dependants, we do not show results for this group.
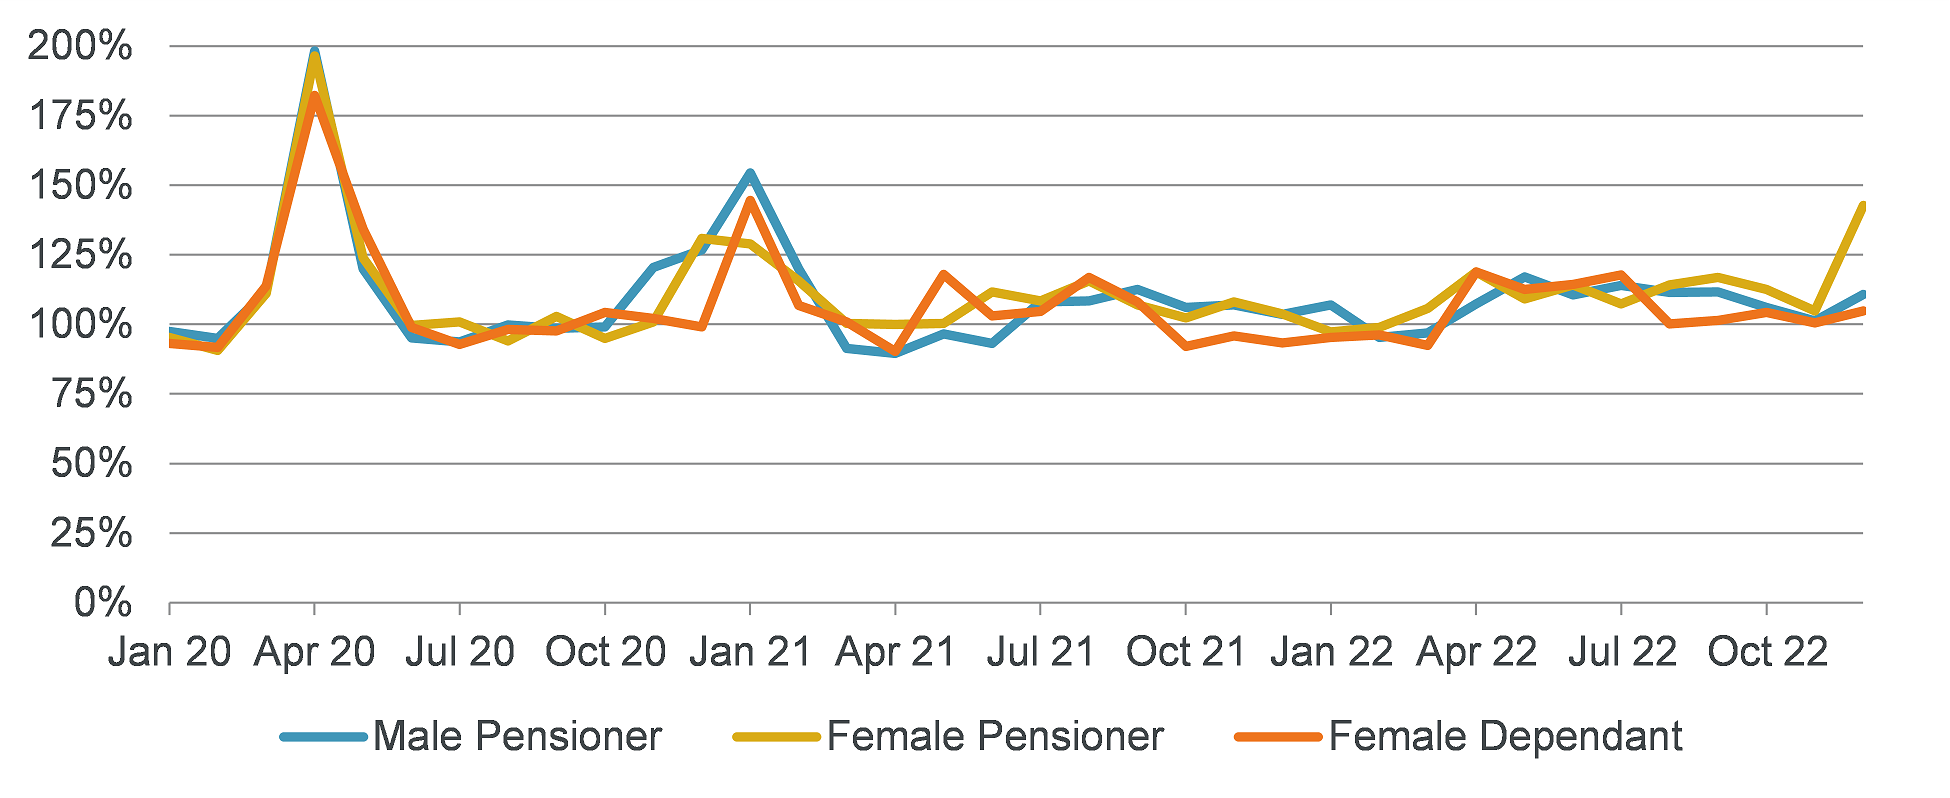
Mortality in the SAPS dataset was higher in March, April and May 2020 than in the corresponding months of 2019, and peaked in April 2020. Experience in late 2020 and the first quarter of 2021 was also heavier than in the corresponding periods in 2019.
Mortality in 2022 has been slightly heavier than in 2019, though we have limited data for this year. There is a notable uptick in mortality for female pensioners in December 2022, but we note there is limited data for this month, and the confidence interval for the result is wide.
While this broad pattern is similar to that seen for the UK general population, comparing ASMRs shows that the SAPS dataset may have had a smaller increase in mortality than the general population between 2019 and 2020 and 2019 and 2021 (we do not have enough data for 2022 to make a clear comparison).
For example, when looking at ages 60-95 for pension schemes with continuous exposure over 2019 and 2020, the ASMRs for SAPS male pensioners increased by 12.0% from 2019 to 2020, while for males in the general population they increased by 15.2%. For SAPS female pensioners the ASMRs increased by 7.1% but for females in the general population they increased by 12.6%. We see similar patterns for the increase in ASMRs from 2019 to 2021 too.
Because data is typically submitted for a pension scheme following its three-yearly valuation, we have much less data for 2020 (8% of the total exposure), 2021 (5% of the total) and 2022 (3% of the total) than for earlier years. (If we had the same data volume for each year, we would have 12.5% of the exposure in each year.)
The data for 2020, 2021, and 2022 is also weighted towards the period up to 5 April in each year. This means that the data available to us for these years (and in particular, for 2021) may not be fully representative of the wider SAPS dataset. We will review our findings as we receive more data.
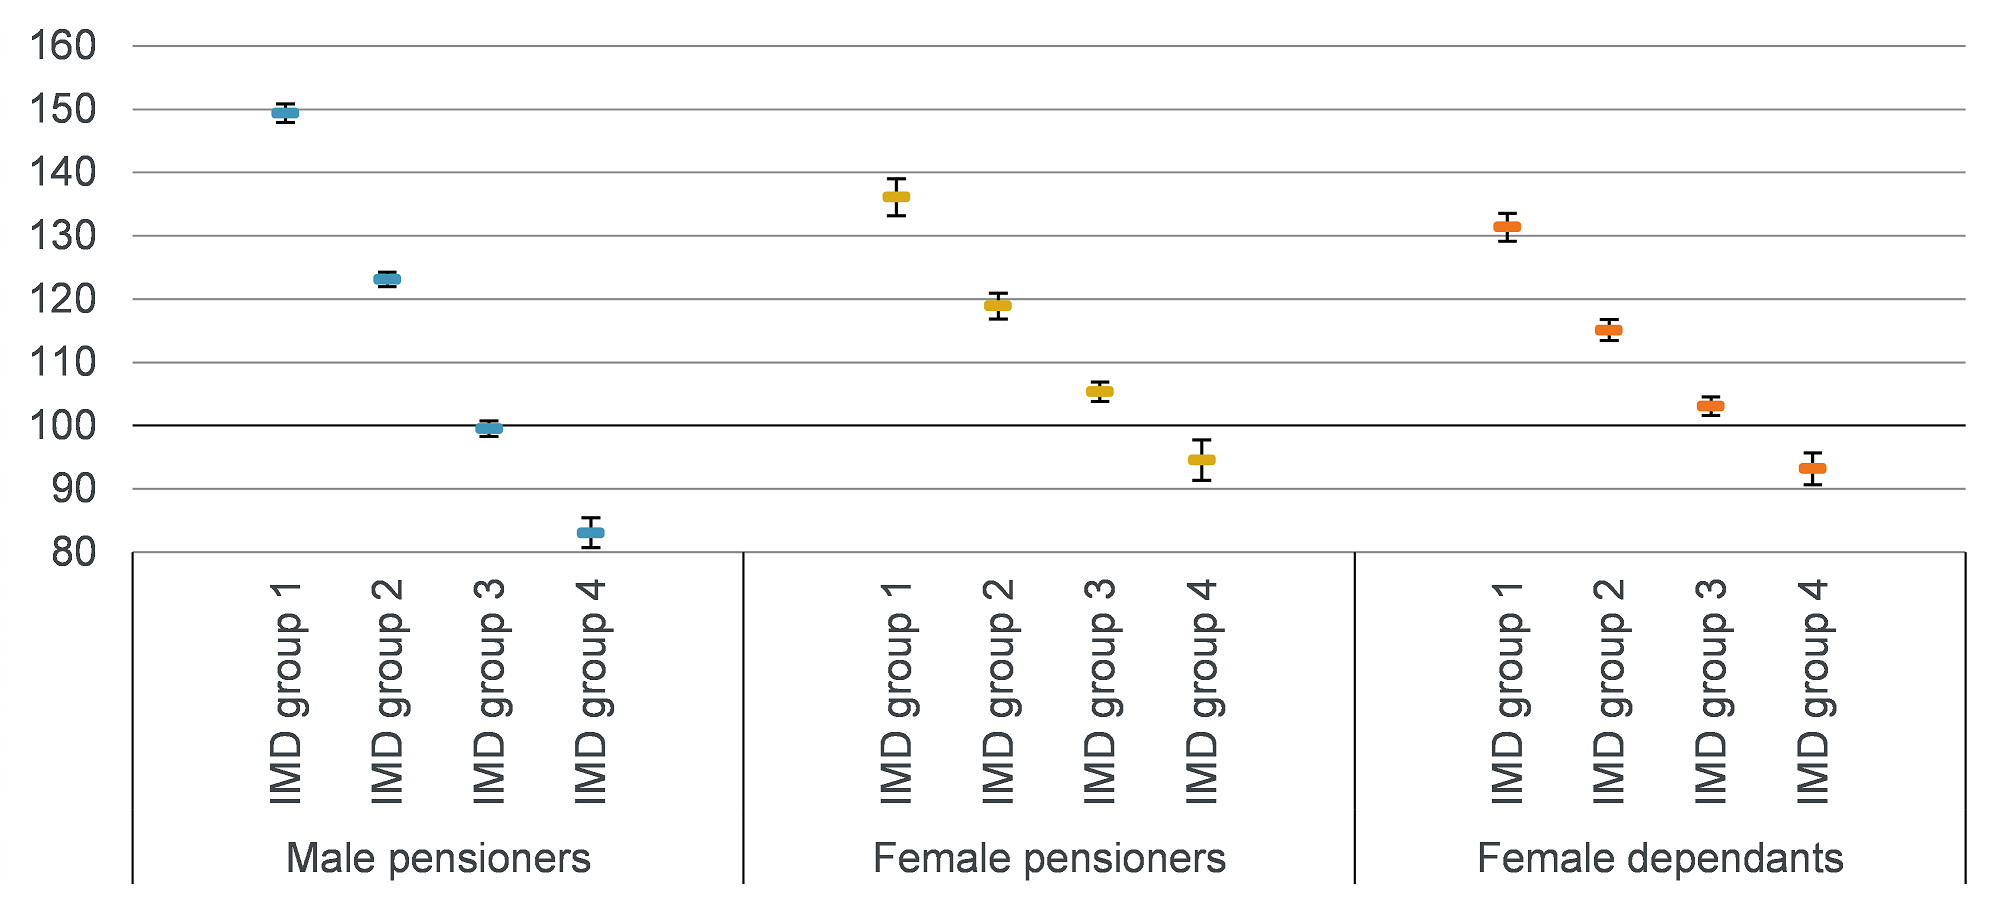
The S4 mortality tables, published in April 2024, included twelve new amounts-weighted tables which incorporated Index of Multiple Deprivation (IMD) as well as pension amount, with four tables for each of male pensioners, female pensioners, and female dependants. For each set of four tables, we split the relevant part of the dataset into a large number of “cells”, defined by a combination of IMD deciles and pension amount bands, and then assigned each of the cells to four “IMD groups”, so that cells with similar mortality were assigned to the same group.
We have analysed the experience for each IMD group in this dataset relative to the relevant S4 IMD table without projection. The experience in this dataset is fairly close to the mortality rates in the S4 IMD tables – which might be expected, as this dataset (covering 2015-2022) is relatively similar to the dataset underlying the S4 tables (covering 2014-2019). There continues to be a wide spread of mortality between the IMD groups.
We have also compared actual experience over 2015-2022 with what would have been expected based on the S4 mortality tables, projected using CMI_2022 (the latest version of the CMI Mortality Projections Model available at the time of our calculations). For most subsets of the data, mortality has been a little heavier than the projected S4 mortality rates. As we are including the relatively heavy calendar years 2020, 2021, and 2022 in this analysis, but excluded these years from the S4 tables; this is to be expected.
We will continue to collect pension scheme data and publish annual analysis of mortality experience.
We are beginning work on a “multi-factor” analysis of mortality in pension schemes, considering industry and region as well as IMD and pension amount, which we aim to publish by the end of September 2024