 Matt Fletcher, Chair of the CMI SAPS Committees, summarises key points from the CMI’s latest annual analysis of the mortality experience of members of UK defined benefit pension schemes.
The Continuous Mortality Investigation (CMI) Self-administered Pension Schemes (SAPS) Committee has published its latest annual analysis of the mortality experience of members of UK defined benefit pension schemes. This covers the period 2014 to 2021, so is the second to include experience during the COVID-19 pandemic.
This blog briefly summarises key points from the analysis. CMI subscribers can find more detail in Working Paper 169.
The SAPS investigation collects data for self-administered defined benefit pension schemes with more than 500 pensioners. This is provided by actuarial consultancies, the Pension Protection Fund (PPF), and the Government Actuary’s Department (GAD) and covers both private sector and public sector schemes.
The 2014 to 2021 dataset is large, comprising over 400 pension schemes, and nearly 30,000,000 person-years of exposure.
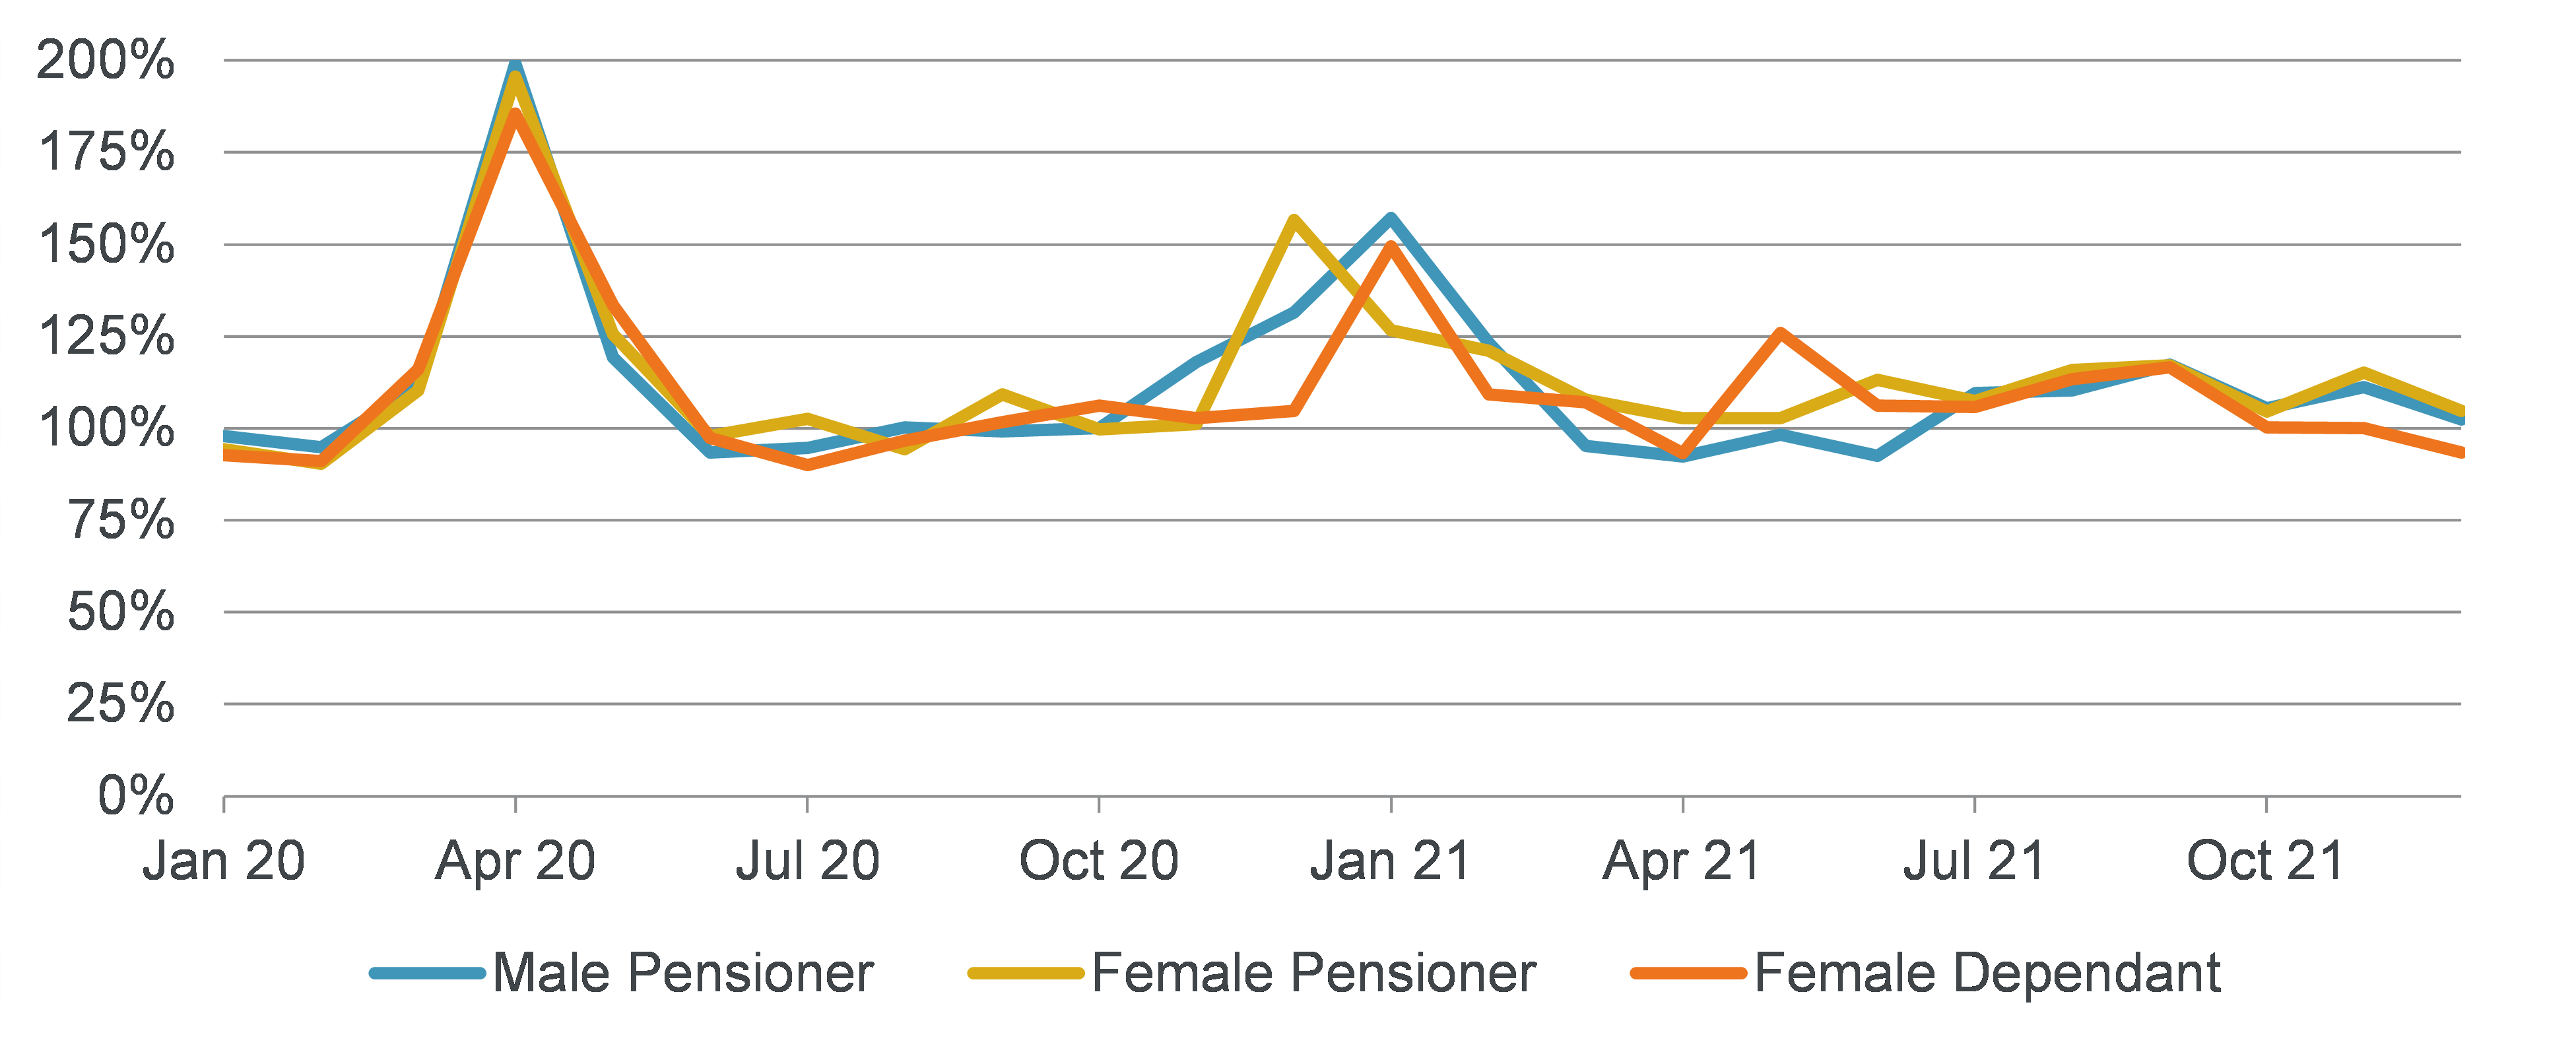
Mortality in the SAPS dataset was higher in March, April, and May 2020 than in the corresponding months of 2019, and peaked in April 2020. Experience in late 2020 and the first quarter of 2021 was also heavier than in the corresponding periods in 2019.
We show a ratio of the 2020 and 2021 age-standardised mortality rates (ASMRs) to the 2019 ASMRs in the following chart. Given the low volumes of data for male dependants, we do not show results for this group.
This broad pattern is similar to that seen for the UK general population. However, comparing ASMRs shows that the SAPS dataset may have had a smaller increase in mortality than the general population between 2019 and 2020 as well as between 2019 and 2021. For example, when looking at ages 60 to 95 for pension schemes with continuous exposure over 2019 and 2020, the ASMRs for male pensioners increased by 12.5% from 2019 to 2020, while for the general population they increased by 15.0%. For female pensioners the ASMRs increased by 8.4% but for the general population they increased by 12.4%. We see similar patterns for the increase in ASMRs from 2019 to 2021 too.
Because data is typically submitted for a pension scheme following its three-yearly valuation, we have much less data for 2020 (6% of the total exposure) and 2021 (3% of the total) than for earlier years. (If we had the same data volume for each year, we would have 12.5% of the exposure in each year.)
The data for both 2020 and 2021 is also weighted towards the period up to 5 April in each year. This means that the data available to us for these years (and in particular, for 2021) may not be fully representative of the wider SAPS dataset. We will review our findings as we receive more data.
We have separately analysed the mortality experience of three sectors: private sector, local authority (for example Local Government Pension Schemes), and other public sector (for example central government or Civil Service pension schemes).
There are low volumes of public sector data (both local authority and other public sector) beyond the first quarter of 2020, so the results do not allow for the effect of the pandemic.
Overall, the mortality experience of other public sector schemes is lighter than the experience of local authority and private sector schemes. The mortality experience of local authority data is similar to the experience of private sector data.
For all three sectors, pensioners with higher pension amounts have lower mortality rates and there is more variation by pension amount for males than females.
We have compared actual experience over 2014 to 2021 with what would have been expected based on the “S3” Series pensioner mortality tables, projected using CMI_2021, the latest version of the CMI Mortality Projections Model. On an amounts-weighted basis for pensioners, mortality has been a little higher than would have been expected. For dependants (that is, surviving spouses of deceased pensioners), it has been a little lower. This may have been influenced partly by changes in the composition of the SAPS dataset over time rather than being solely due to mortality improvements.
Looking at specific pension amount bands, we find that mortality has been lower than expected for those with smaller pensions and higher than expected for those with larger pensions. This is much more notable for female pensioners than for male pensioners, but present for both. So the actual range of mortality for pensioners with different pension amounts has been smaller than expected based on the “S3” series tables.
We will continue to collect pension scheme data and publish annual analysis of mortality experience.
We are working on the next set of pension scheme mortality tables – the “S4” Series. In particular we are considering how best to reflect the socio-economic differences analysed in Working Paper 146, and how to deal with mortality during the pandemic. We expect to consult on the methods and broad approach in spring 2023 and consult on the proposed tables in autumn 2023.