 The Continuous Mortality Investigation (CMI) Self-administered Pension Schemes (SAPS) Committee has published its latest annual analysis of the mortality experience of members of UK defined benefit pension schemes. This covers the period 2017-2024 and includes data received up to September 2025.
This blog briefly summarises key points from the analysis. CMI Subscribers can find more detail in Working Paper 209.
The SAPS investigation collects data for UK self-administered defined benefit pension schemes with more than 500 pensioners. This is provided by actuarial consultancies, the Pension Protection Fund (PPF) and the Government Actuary’s Department (GAD) and covers both private sector and public sector schemes.
The 2017-2024 dataset is large, comprising over 350 pension schemes, and around 22,500,000 person-years of exposure. However, it is slightly smaller than datasets for other recent periods, so we would like to encourage firms to submit data for all schemes with 500 or more pensioners. Unless more data is submitted to replace the older data as it drops out, the quantity of data will diminish and our ability to analyse experience will be reduced. See the SAPS Coding Guide for more information about data submission.
The majority of the results in the paper are shown for an eight-year period from 1 January 2017 to 31 December 2024.
We have also considered the experience in three periods: 2017 to 2019 (“pre-pandemic”), 2020 and 2021 (“pandemic”), and 2022 to 2024 (“post-pandemic”). Chart 1 shows the difference in 100A/Es between these periods. Given the low volumes of data for male dependants, we do not show results for this group.

For all pensioner types, 2020-2021 experienced the heaviest mortality, as we might have expected. For male pensioners and female dependants, the experience in 2022-2024 was lighter than in 2017-2019. For female pensioners, the experience in 2022-2024 was heavier than in 2017-2019.
It is important to note that:
To better understand the impact of the pandemic on mortality in 2020 and 2021, we have analysed the experience of a small subset of the overall dataset that has continuous exposure from 1 January 2019 to 31 December 2021. Excluding submissions that do not have exposure over the whole of this period enables a clearer like-for-like comparison between 2019, 2020 and 2021, and avoids distortions from partial calendar years of exposure.
We note that the dataset is relatively small and only contains information on 33 pension schemes.
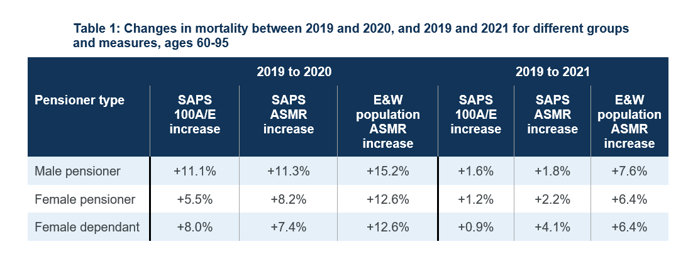
Table 1 shows the 100A/Es and the age-standardised mortality rates (ASMRs) for this dataset compared to the ASMRs for the general population of England and Wales (E&W) over the same time period.
All three pensioner types experienced materially heavier mortality in 2020 than in 2019, and slightly heavier mortality in 2021 than in 2019. For both 2020 and 2021, all three groups saw a lower increase in 100A/Es and ASMRs than the increase in ASMRs for the general population (we note that 100A/Es and ASMRs are not directly comparable).
We have also compared actual experience over 2017-2024 with what would have been expected based on the S4 mortality tables, both without and with projections from CMI_2024 (the latest version of the CMI Mortality Projections Model available at the time of our calculations).
Compared to the unprojected S4 tables, mortality tended to become lighter over the period to 2019 but was heavier in 2020, before becoming lighter over the period to 2024. The improvement in experience from 2020 to 2024 is clearest for male pensioners and least clear for female pensioners.
The S4 mortality tables, published in April 2024, included twelve amounts-weighted tables which incorporated Index of Multiple Deprivation (IMD) as well as pension amount, with four tables for each of male pensioners, female pensioners, and female dependants. For each set of four tables, we split the relevant part of the dataset into a large number of “cells”, defined by a combination of IMD deciles and pension amount bands, and then assigned each of the cells to four “IMD groups”, so that cells with similar mortality were assigned to the same group.
We have analysed the experience for each IMD group in this dataset relative to the relevant S4 IMD table without projection. The experience in this dataset is fairly close to the mortality rates in the S4 IMD tables – which might be expected, as this dataset (covering 2017-2024) overlaps with the dataset underlying the S4 tables (covering 2014-2019). There continues to be a wide spread of mortality between the IMD groups.
We will continue to collect pension scheme data and publish annual analyses of mortality experience.
We typically also produce a “one-off” analysis each year, with the latest being the analysis on the efficacy of the S4 IMD tables published as Working Paper 205. We are currently considering options for the topic of the next one-off analysis.